
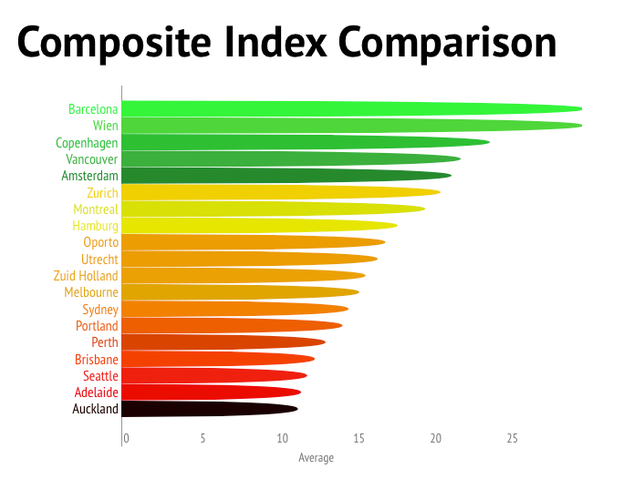
The Benchmark Composite is a combination of each indicator that effectively creates an overall accessibility of the city
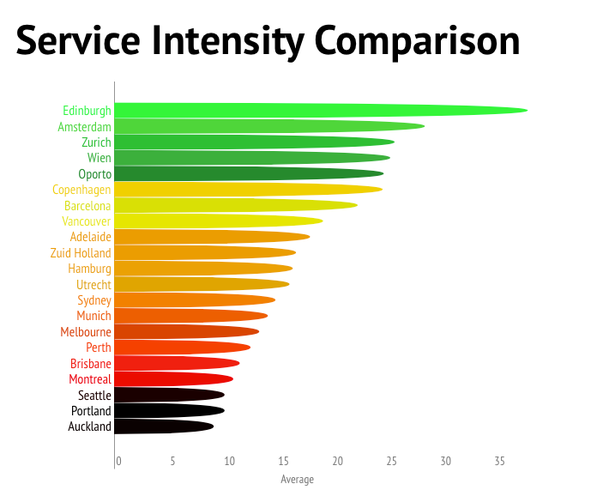
Indicates the number of transport vehicles available for use within the network or essentially, the networks current capacity
Indicates the distance between nodes, in terms of travel time and service frequency which is expressed as travel impediment
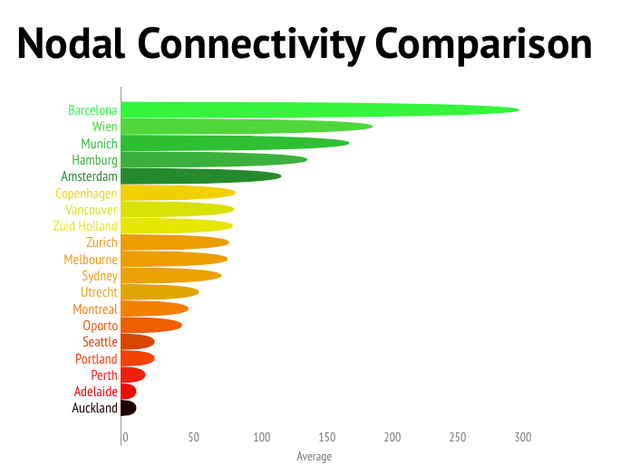
Indicates the average minimum number of transfers to/from all other nodes in the network
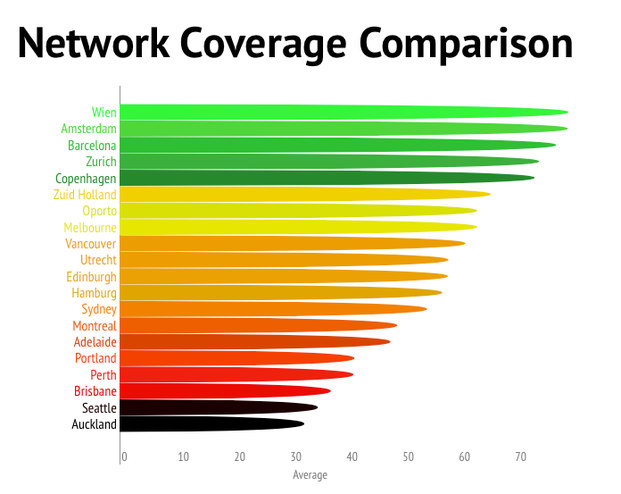
Indicates the percentage of metropolitan residents and jobs in nodal catchments within 30 minutes travel time from references nodes
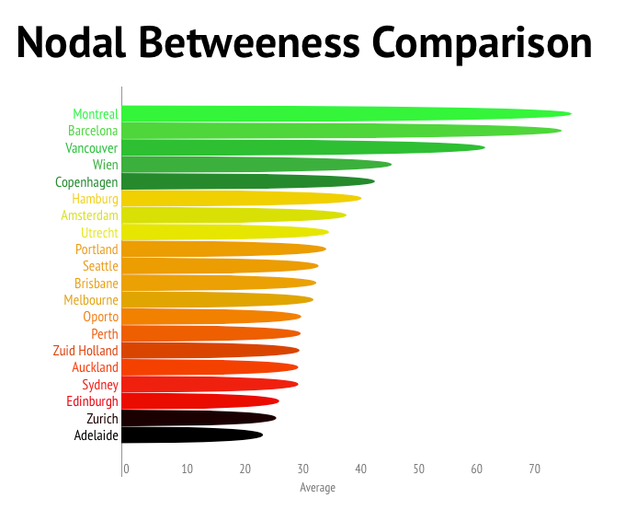
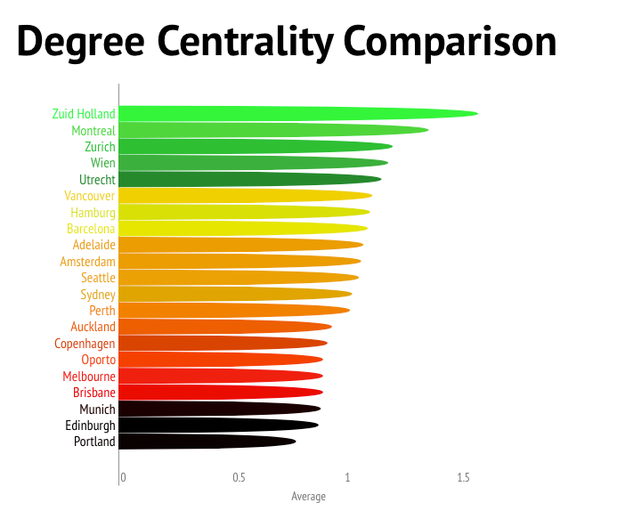
Indicates the number of network paths that pass through activity nodes, weighted by combined activity node catchment and cumulative impediment
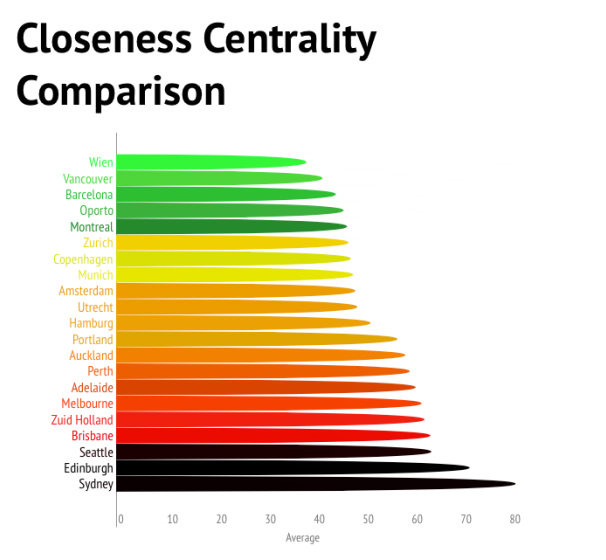
Indicates the ability for activity nodes to act as a hub for the network
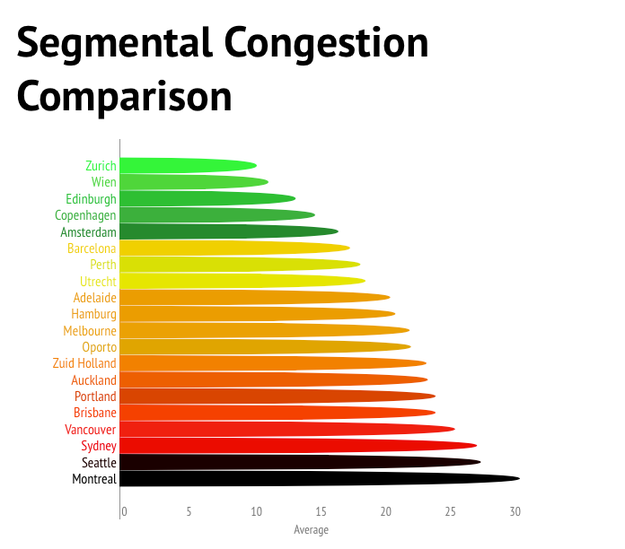
Indicates the number of network paths that pass through a route segment, weighted by combined activity catchment and cumulative impediment
