IntroductionThe Spatial Network Analysis for Multimodal Urban Transport Systems (SNAMUTS) methodology has been developed as a planning and decision-making support tool. It determines accessibility performance from a user perspective, bearing in mind that different users sometimes have different needs: some may value speed more than anything else, some may require barrier-free access as their first priority, others may be drawn primarily to services that are legible and have a high profile in the urban realm. Good accessibility is often the result of a balance and integration of these sometimes competing, sometimes complementary claims on the useability of the land use-transport system.

Related Websites |
The SNAMUTS IndicatorsService intensity
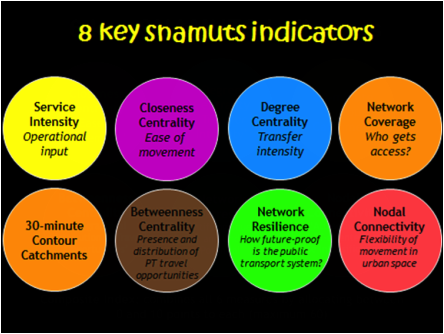
What is the number of public transport services required to achieve an optimal level of accessibility across the network, noting that the resources may be limited? Closeness centrality What is the ease of movement offered on public transport across the city and for each route? Fast and/or frequent services reduce ‘spatial resistance’ to the user compared to slow and/or infrequent services. Degree centrality What is the transfer intensity of the network? While transfers are a necessary component of an integrated public transport system, is there a way of measuring whether their occurrence may be excessive or underdeveloped? Network coverage What is the percentage of residents and employees within walking-distance to public transport services at a standard that allows for both planned and spontaneous trip making across most hours of the day, seven days a week? Contour catchments What is the geographical range users can cover by way of a public transport journey within a particular time frame, and how many destinations are located within this range? Betweenness centrality How does the public transport network channel, concentrate and disperse the travel opportunities generated by the interplay of land uses and the transport system? Resilience Where on the network do these effects result in a potential mismatch between public transport supply and potential demand? Nodal connectivity How well is each activity centre connected in order to attract stopovers on public transport chain journeys and encourage land use intensification to capitalise on such flows of people? Composite Accessibility Index How can the results of these indicators be calibrated to arrive at a comparative scale for public transport accessibility between different cities and within one city over a time line? |
About SNAMUTS
Spatial Network Analysis for Multi-modal Urban Transport Systems or SNAMUTS is a collaborative international research project headed by Professor Carey Curtis and Doctor Jan Scheurer.

